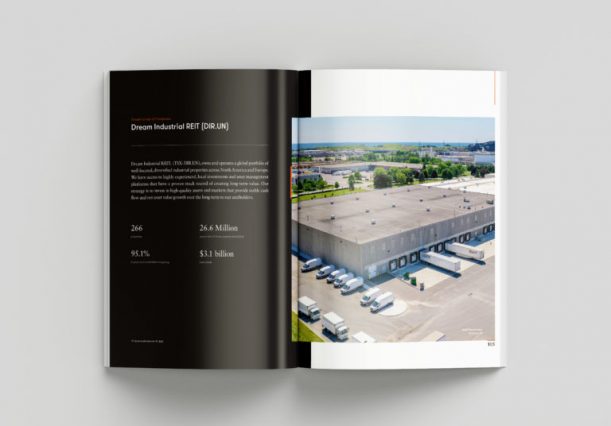
Dream Industrial REIT (TSX: DIR.UN)
View 2024 Industrial Sustainability Report2024 Highlights
-
 GRESB
GRESBScored 68/100 in the 2024 GRESB(1) Real Estate Assessment and ranked 1st out of 10 in the Northern America | Industrial Comparison Group in the 2024 GRESB Public Disclosure
-
 10.3 (Low)
Sustainalytics(2)(3) ESG Risk Rating (0-40+; 0 = best)
-
 BBB
BBBMSCI ESG Rating(4)(5) (CCC-AAA; AAA = best)
-
 $1.5 million
Net Operating Income (“NOI”) generated in 2024 from solar program across Canada and Europe
-
21 MW
renewable energy installed capacity, 23 solar projects completed as of December 31, 2024
-
273
electric vehicle charging stations(6) across the portfolio
-
$850 Million
green bonds issued, over $708 million in eligible green projects have been deployed from 2021 to 2023. Approximately $200 million in eligible green projects were deployed in 2024
-
15.7 million sf
of LED upgrades completed
-
5.8 million sf
of completed green building certifications(7)
(1) All intellectual property rights to this data belong exclusively to GRESB B.V. All rights reserved. GRESB B.V. has no liability to any person (including a natural person, corporate or unincorporated body) for any losses, damages, costs, expenses, or other liabilities suffered as a result of any use of or reliance on any of the information which may be attributed to it.
(2) As at March 19, 2025.
(3) Copyright © 2024 Morningstar Sustainalytics. All rights reserved. This section contains information developed by Sustainalytics (www.sustainalytics.com). Such information and data are proprietary of Sustainalytics and/or its third-party suppliers (Third Party Data) and are provided for informational purposes only. They do not constitute an endorsement of any product or project, nor an investment advice and are not warranted to be complete, timely, accurate or suitable for a particular purpose. Their use is subject to conditions available at www.sustainalytics.com/legal-disclaimers.
(4) As at May 1, 2025.
(5) The use by Dream of any MSCI ESG Research LLC or its affiliates (“MSCI”) data, and the use of MSCI logos, trademarks, service marks or index names herein, do not constitute a sponsorship, endorsement, recommendation, or promotion of Dream by MSCI. MSCI services and data are the property of MSCI or its information providers and are provided ‘as-is’ and without warranty. MSCI names and logos are trademarks or service marks of MSCI.
(6) Includes EV chargers owned or installed by tenants.
(7) Green building certifications include LEED, BREEAM, BOMA Best, DGNB, CaGBC and ZCB. Buildings with multiple certifications have their certified area accounted for only once. Excludes GLA for properties under development that have achieved ZCB-Design certification.
ESG Scorecard
| Indicator | 2019 Baseline | 2023 | 2024 | YoY% Change | % Change from Baseline |
| Energy | |||||
| Energy Consumption (GJ)(2)(3)(4) | 143,559 | 132,664 | 127,329 | -4%(5) | -11%(5) |
| Water | |||||
| Water Consumption (m3)(3)(8) | 284,744 | 340,773 | 326,686 | -4%(5) | – |
| GHG Emissions(6) | |||||
| Scope 1 & 2 GHG Emissions (tCO2e)(2)(3)(4) | 9,455 | 8,170 | 7,148(7) | -13%(5) | -24%(5) |
| Indicator | 2022 | 2023 | 2024 |
| Employees | 103 | 136 | 154 |
| Voluntary turnover rates | 14% | 14% | 6% |
| Women employees(9) | 50% | 49% | 50% |
| Women managers(10) | 52% | 52% | 52% |
| Women executives(11) | 33% | 33% | 33% |
| Indicator | 2022 | 2023 | 2024 |
| Women Directors(12) | 57% | 63% | 57% |
| Independent Directors(12) | 71% | 88% | 71% |
(1) Excludes co-owned properties in the U.S. Fund and Dream Summit JV. Please refer to ESG Data Book for more detail including data coverage, regional breakdown, sources of emission factors and breakdown of Scopes of emissions.
(2) Energy and emissions estimated for vacant units is excluded. Please refer to the ESG Data Book for assured aggregated energy and emissions.
(3) The 2024 data is collected from utility meters under DIR.UN’s operational control as at December 31, 2024 across the portfolio. Please refer to the ESG Data Book for more details.
(4) Commencing in 2023, the data coverage was expanded to include the Netherlands. Commencing in 2024, Germany has also been included in the data coverage.
(5) The comparison is done on absolute data and not like-for-like data. Due to changes in portfolio size, data coverage and change of control over the utility meters, the comparison is not an explicit result of efficiency measures.
(6) GHG emissions are calculated in accordance with the World Resource Institute Greenhouse Gas Protocol. They capture activities DIR.UN has direct and indirect operational control over: Scope 1 emissions generated directly from its operations, including heating at properties. Scope 2 emissions indirectly associated with generation of purchased electricity, heating and cooling consumed by properties. The comparative periods are not presented using the emission factors included in the updated 2025 Canadian National Inventory Report, published on May 16, 2025, the updated 2025 National Inventory Report of the Netherlands, published on April 15, 2024, and the updated 2025 National Inventory Report of Germany published on April 15, 2024. As such, trends in emissions may be impacted.
(7) Data has been restated from the 2023 report. Please refer to the ESG Data Book for more details.
(8) Commencing in 2024, water data coverage was expanded to include the Netherlands and Germany.
(9) Includes employees at all levels.
(10) Includes managers and above.
(11) Includes the Chief Executive Officer, Chief Investment Officer and Chief Financial Officer of DIR.UN, who are employees of Dream Asset Management Corporation.
(12) Board composition as at December 31, 2024.
Sustainability at DIR.UN is managed by the following(1):
-
Board of Trustees
+
Oversee ESG matters, with responsibility for this oversight delegated to the Governance, Compensation and Environmental Committee
-
Governance, Compensation and Environmental Committee
+
Oversee approach to environmental, social and governance matters
-
Chief Executive Officer (highest-level executive with oversight over ESG matters, including sustainability and climate change)
+
Work with the Chief Financial Officer to provide leadership over the sustainability strategy and oversee adoption of the ESG Framework
-
ESG Operating Committee (Members of the Executive Leadership team from each Dream entity)
+
Receive regular updates from the Sustainability and ESG team on behalf of all departments and the sustainability working groups
Adopt ESG Framework
Communicate sustainability strategy across the company and to key external stakeholders
Delegate implementation to Sustainability and ESG team
Reports to the Governance, Compensation and Environmental Committee of Dream Impact Master GP Inc. -
Sustainability and ESG Team
+
Embed sustainability strategy across the company and with key external stakeholders
Oversee the implementation of the ESG Framework for each Dream entity
Manage portfolio sustainability initiatives including building certifications, energy, water and waste management and monitoring, as well as strategic initiatives
Meet quarterly with the ESG Operating Committee
-
Sustainability Working Groups (currently includes the Employee Engagement working group
+
Advance sustainability initiatives and activities at company level
Involve representatives from across functions, regions, and properties and report regularly to the Sustainability and ESG team
-
Investment Committee
+
Review each investment’s Acquisition Checklist and approve investments that meet both financial and impact goals
Hold the project team accountable to achieve goals and create impact
(1) The responsibilities set out in this column are for illustrative purposes only, reflect certain relevant ESG matters, and do not purport to reflect the full extent of responsibilities or the full mandate of any of the boards, committees or teams referred to in this chart.
Heat Pump Replacements
In 2024 Dream Industrial replaced 56 conventional rooftop HVAC units with air source heat pump roof top units in Ontario and Québec. Where electrical capacity permitted, heat pumps were installed with electric resistance backup for heating during cold winter days. In other cases, dual fuel heat pumps were used to enhance energy efficiency and resilience without increasing the electrical load on the grid. Dual fuel heat pumps use natural gas for backup heating on cold winter days. Typically, air source heat pumps are 2 to 2.5 times more energy efficient than conventional rooftop units.
Dream Industrial is expected to secure approximately $725,000 in savings by expediently and proactively pursuing federal tax and utility-based incentives. The incentive savings will be applied against the upfront capital investment, supporting the decarbonization of the portfolio, reducing portfolio emissions and generating energy cost savings for tenants.
The chart above estimates emission reductions from retrofitting rooftop units serving the office spaces in industrial buildings with dual fuel heat pumps in Ontario. Results are shown per refrigeration tonne of the equipment.

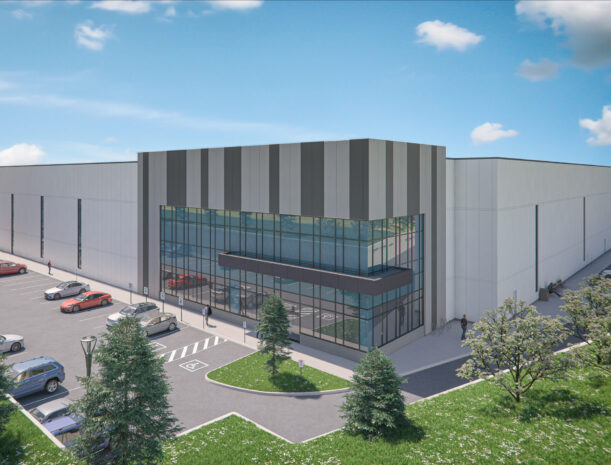
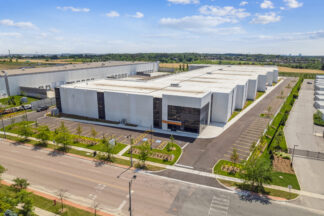
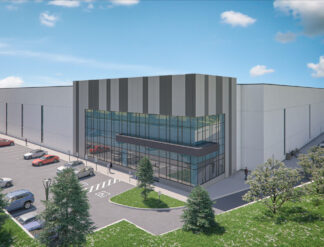
Zero Carbon Building Design
As part of its net zero strategy, Dream Industrial has developed a design concept focused on achieving Canada Green Building Council’s (“CaGBC”) Zero Carbon Building (“ZCB”) Design Certification for new developments. Geared towards guiding the design and retrofitting of buildings to achieve zero carbon, the certification requires projects to demonstrate their capability to reduce embodied and operational GHG emissions, improve energy efficiency, and reduce peak energy demand.
In 2024 Dream Industrial’s developments at 1100 Courtneypark Drive, Mississauga, Ontario, and 220 Water Street, Whitby, Ontario, representing 600,000 sf, achieved CaGBC’s ZCB Design v2 Certification. Design features of these developments include a reinforced roof with the capacity to install a rooftop solar PV system, approximately 70% of all building systems are designed to be electric, and high efficiency upgrades including HVAC systems and roof insulation.
Dream Industrial will continue to refine and improve its net zero development process and to expand its portfolio of high-efficiency and low carbon buildings to deliver on its net zero ambition.
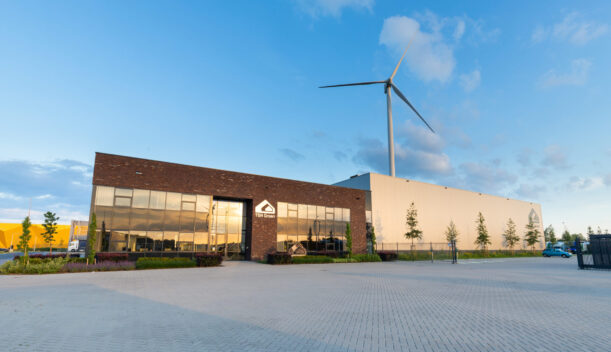
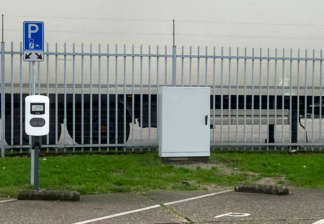
EV Charging Infrastructure at Laan van Ypenburg
As part of its net zero strategy, Dream Industrial is focused on expanding the electric vehicle (“EV”) charging infrastructure across its portfolio. The installation of EV chargers future proofs assets to address tenant demand and proactively prepares for regulations in Canada and Europe that intend to accelerate EV adoption. Across its portfolio, Dream Industrial has 273 EV charging stations, including chargers owned or installed by tenants.
In 2024, Dream Industrial implemented a strategic initiative at Laan van Ypenburg, a 665,000 sq ft urban logistics property in the Hague, Netherlands by installing five double outlet EV chargers. The charging fees collected from tenants using the stations are estimated to generate a yield on cost of over 20%, effectively converting a typically non-recoverable capital expense into a new revenue stream.
The project demonstrates the business case for integrating sustainability initiatives into property management strategies, while meeting regulatory requirements, tenant demand and driving emissions reduction.

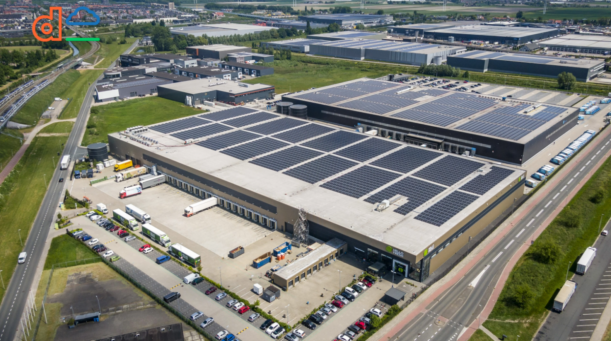
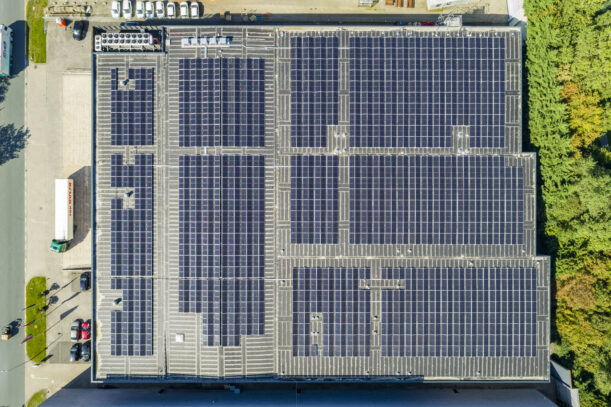
Maximizing Solar Value Through a Phased Approach
Overview:
Dream Industrial launched a multi-phase solar project at a 350,000 sf facility in Calgary, Alberta, to enhance sustainability and energy efficiency.
Phase 1: Initial Deployment (2023):
Installed a 1.5 MW rooftop solar system, optimizing roof space and solar exposure. This phase proved the concept to the tenant, and reduced tenant operating costs.
Phase 2: Expansion & Upgrades (2024):
Upgraded roofing and electrical infrastructure to support an additional 400 kW of solar capacity, boosting total renewable generation by 20%.
Phase 3: Final Expansion (Targeting commencement in 2025):
Building on the success of the previous phases, Phase 3 aims to further increase solar capacity potential by 20% and explore battery storage integration.
Key Benefits:
-
Enhanced Revenue: Solar income creates an additional source of revenue, generating attractive returns on capital investments. The Phase 1 & 2 projects have maximized government incentive opportunities to reduce Dream Industrial’s overall capital commitment. The average estimated yield on cost for these projects is over 7%.(1)
-
Cost Savings: The tenant has experienced a consistent reduction in electricity expenses, improving operational efficiency.
-
GHG Emission Reductions: The Phase 1 & 2 projects are estimated to avoid 24,000 tonnes of carbon dioxide equivalent (tC02e) over the lifetime of the projects.
-
Energy Resilience: Enhanced infrastructure and on-site generation improve energy reliability and resilience.
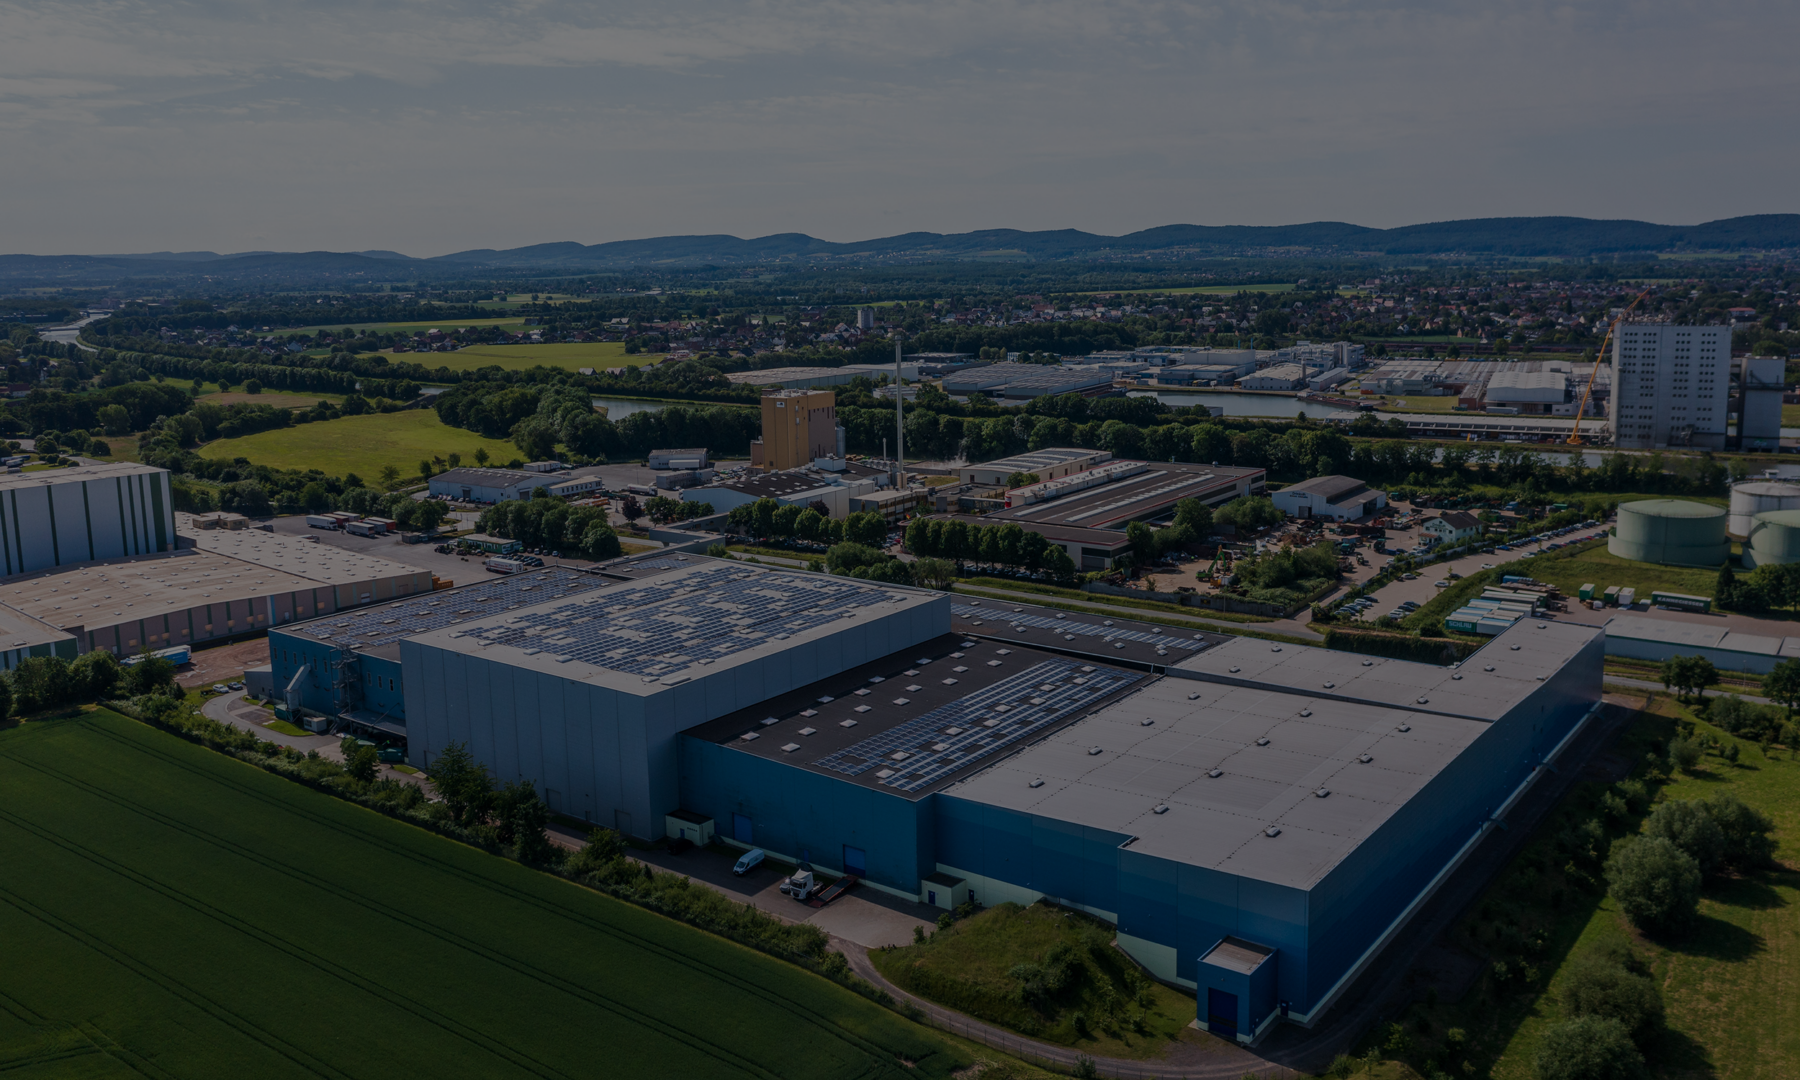
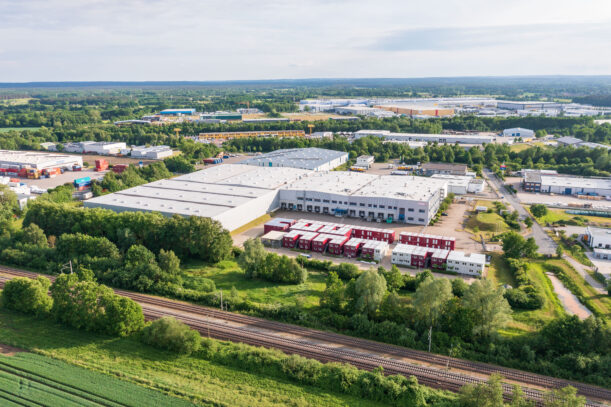
Addressing Grid Capacity Constraints with Solar
In parts of the Netherlands, grid congestion is a growing issue that can pose challenges for tenants including power outages, business disruptions and increased costs to procure reliable sources of energy.
In 2024, Dream Industrial negotiated an agreement with a tenant for a solar photovoltaic (PV) system which provides a solution to grid limitations by generating power on-site.
Dream Industrial optimized the long-term lease agreement with the tenant, which enabled them to secure maximized energy cost efficiency. The use of the PV system provides the tenant with access to additional power without relying solely on grid capacity.
The 0.8 MW system is expected to be fully operational in 2025, and with a yield on cost of over 9.5%, this project represents Dream Industrial’s innovative approach to resolve real estate challenges with sustainable solutions, the outcomes of which:
- Address grid capacity limitations
- Enhance sustainability
- Improve lease stability and support tenant retention
- Generate robust financial returns
Charitable Donations
In 2024, Dream Industrial’s regional teams in Canada and Europe selected charities that support causes and impact the communities within which they operate. The supported charities focused on areas such as food banks, children’s health, and services for individuals facing homelessness. Dream Industrial made $77,500 in charitable
donations in 2024.
To promote community impact, the Dream group encourages all Dream Industrial employees to take part in the following initiatives available to them:
-
One paid volunteering day per year
-
$500 awarded annually through the employee donation program where contributions are made to charitable organizations that employees are actively involved with
-
$1,000 awarded to five employees through Dream’s ETHOS awards program to contribute to a cause they believe in

Green Lease Program
Dream Industrial has adopted a green lease as its standard lease across Canada and has integrated green lease considerations into its lease negotiations in Europe. The green lease program includes tenant commitments to energy disclosures, low carbon construction practices, the purchase of on-site renewable energy (if available), energy efficiency engagement and training, and cost recovery clauses for energy efficiency upgrades. In 2024, 4.2 million sf of green leases were executed across Canada and Europe.
Green Lease Leaders(1)
Dream Industrial received the Platinum level recognition under the Green Lease Leaders program in 2023, demonstrating its drive to engage with internal leasing teams and external brokers on energy efficiency, climate change, and net zero building design. Dream Industrial continues to integrate innovative and leading sustainability initiatives into its leasing program.
(1) Green Lease Leaders is a three-year recognition program for landlords, tenants, and teams who integrate green leasing into their standard practices.


Sustainability Reports
- Green Financing +
-
Previous years
+
-
2023 Dream Sustainability Report
↗ -
2022 DIR.UN Sustainability Report
↗ -
2022 Dream Group of Companies Sustainability Report
↗ -
2021 DIR.UN Sustainability Update Report
↗ -
2021 Dream Group of Companies Sustainability Update Report
↗ -
2021 DIR.UN Sustainability Report
↗ -
2020 – 2021 Dream Group of Companies Sustainability Report
↗ -
2019 DIR.UN Sustainability Report
↗ -
2019 Dream Group of Companies Sustainability Report
↗
-
-
Policies
+
Declaration of Trust
Dream Industrial REIT’s Declaration of Trust governs our operations and includes such topics as investment guidelines and operating policies, financing restrictions, units and distributions, and the responsibilities and obligations of the Trustees.
Disclosure PolicyThe objective of our disclosure policy is to ensure that communications to the investing public about Dream Industrial REIT are timely, factual and accurate, and disseminated in accordance with all applicable legal and regulatory requirements. The policy covers topics including trading restrictions and blackout periods, confidentiality, and designated spokespersons. This policy applies to all trustees, officers and employees of Dream Industrial REIT and its subsidiaries.
Code of ConductOur Code of Conduct (the “Code) is our statement of the values and principles that guide us in our day-to-day business activities. The keystones are: integrity, respect, fairness, accountability and transparency. The Code supports our commitment to operate our business at the highest level of legal, moral and ethical standards. The Code applies to all trustees, officers and employees of Dream Industrial REIT and subsidiaries.
Whistleblower PolicyAt Dream Industrial REIT, we are steadfast in our commitment to maintaining the highest business and personal ethical standards by dealing openly and honestly with our investors, tenants, suppliers and employees. With our Whistleblower Policy we marry this commitment to that of securities laws and regulations with respect to accounting standards and internal control standards. We have contracted EthicsPoint Inc., an independent service provider, to manage any complaints or concerns on our behalf. This service reports directly to the Audit Committee of Dream Industrial REIT and is available seven (7) days a week, 365 days a year. Any concerns may be reported directly, confidentially, and, if preferred, anonymously, through www.ethicspoint.com
Majority Voting PolicyThe Trust has a majority voting policy, requiring that each Trustee nominee receive the support of a majority of the total number of votes cast by the unit holders entitled to elect such Trustee nominee, failing which such Trustee shall submit his or her resignation to the Board for consideration.
Diversity Inclusion Advancement CommitmentAs one of Canada’s leading real estate companies, we always invest with purpose, embracing creativity and diversity, passion and innovation, while positively impacting our communities and the world around us.
Board Diversity PolicyDream seeks to maintain a Board comprised of talented and dedicated trustees whose skills and backgrounds reflect the diverse nature of the business environment in which Dream operates. Accordingly, the composition of the Board is intended to reflect a diverse mix of skills, experience, knowledge and backgrounds, including an appropriate number of women trustees.
Environmental PolicyThe Environmental Policy sets out Dream Industrial REIT’s objectives and goals as it relates to protection of the environment. It allows us to identify products, activities and services that minimize adverse impacts on the environment and to introduce them where most effective in our business.